
Download Roambi Analytics – Mobile‑Centric Business Intelligence Tool
Overview: Mobile‑First Business Intelligence Made Simple
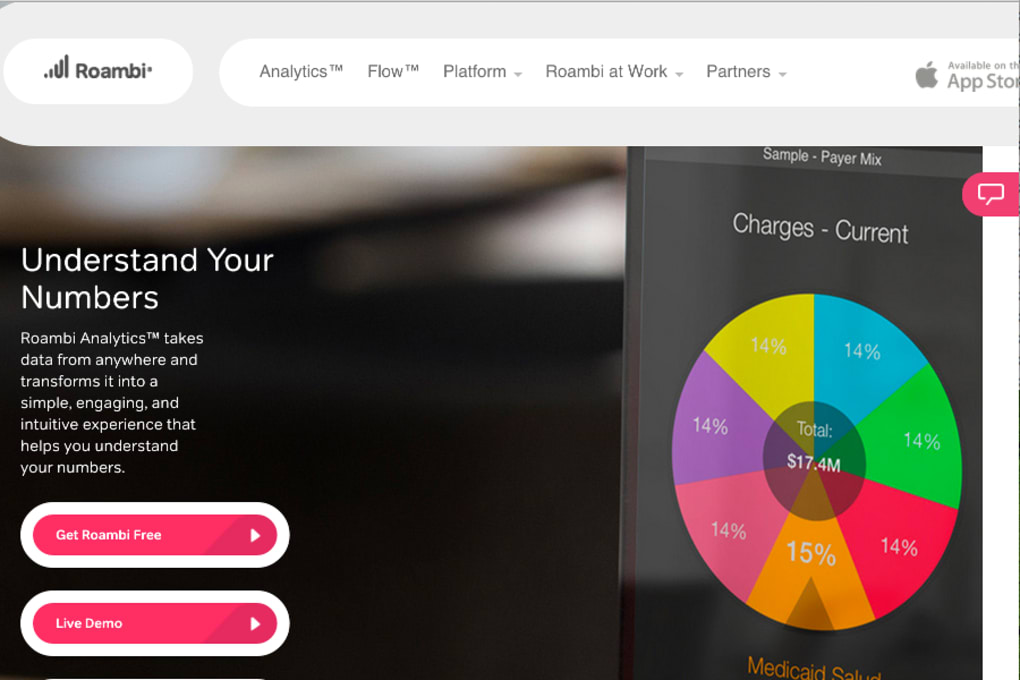
Roambi Analytics is a mobile‑centric analytics and business intelligence platform designed for mid‑size enterprises that need powerful data visualisation without the overhead of traditional server‑based BI solutions. Built from the ground up for smartphones and tablets, Roambi transforms raw data into smart, interactive visualisations that are instantly understandable, even for users without a deep statistical background. The tool connects to a variety of data sources—cloud services, on‑premise databases, and spreadsheets—then renders charts, graphs, and dashboards that adapt fluidly to any screen size.
Because it lives in the cloud, there is no need for costly hardware installations, complex network configurations, or manual software updates; Roambi’s SaaS model ensures you always have the latest features and security patches with a single click. In practice, this means sales teams can walk into a client meeting with a tablet that displays real‑time performance metrics, finance managers can drill down into expense trends while commuting, and executives can receive push notifications of key KPI changes directly on their phones. The platform also offers a collaborative workspace where users can comment on dashboards, share insights, and export visualisations to PowerPoint or PDF for polished presentations.
While the learning curve can be a bit steep for newcomers, Roambi provides an extensive learning centre, video tutorials, and in‑app guidance that help staff become proficient quickly. Overall, Roambi Analytics delivers a secure, flexible, and future‑proof BI experience that aligns perfectly with today’s mobile‑first work culture.
Key Features That Power Smarter Decision‑Making
- Mobile‑Optimised Visualisations: Interactive charts, maps, and tables that automatically resize for iOS, Android, and Windows tablets.
- Cloud‑Based Data Engine: Real‑time data sync from Salesforce, Microsoft Dynamics, Oracle, MySQL, and flat‑file sources without on‑premise servers.
- Drag‑and‑Drop Dashboard Builder: No‑code interface that lets users create custom dashboards in minutes.
- Offline Access: Cached visualisations let users view reports when connectivity is limited, with automatic refresh once back online.
- Secure Enterprise‑Grade Controls: Role‑based permissions, SSO integration, and end‑to‑end encryption protect sensitive business data.
- Collaboration & Sharing: In‑app comments, URL sharing, and export options to PowerPoint, PDF, and CSV for seamless stakeholder communication.
- AI‑Driven Insights: Automated trend detection and anomaly alerts that surface hidden opportunities without manual analysis.
- Scalable Subscription Model: Tiered pricing that grows with your user count, making it affordable for midsize organisations.
Each of these capabilities is designed to reduce the time spent wrestling with spreadsheets and static reports. For example, the AI‑driven insights engine continuously scans incoming data streams and highlights outliers, enabling a sales manager to spot a sudden dip in regional performance and act before the quarter ends. Meanwhile, the drag‑and‑drop builder eliminates the need for a dedicated developer; a marketing analyst can assemble a campaign performance dashboard in under an hour and push it to the entire team with a single tap. Security is never an afterthought—Roambi leverages OAuth, SAML, and multi‑factor authentication to meet the strict compliance requirements of regulated industries such as finance and healthcare. All of these features combine to make Roambi Analytics a comprehensive, future‑ready solution for organisations that demand both agility and depth in their analytics stack.
Installation, Usage & Compatibility Guide
Getting started with Roambi Analytics is intentionally straightforward. Because it is a cloud‑hosted service, the only “installation” step required is creating an account on the Roambi website. After signing up, you receive an email invitation to download the mobile app from the Apple App Store or Google Play Store.
The desktop version is also available as a web app that runs in any modern browser (Chrome, Edge, Firefox, Safari). Once the app is installed, the initial launch prompts you to connect your data sources. Roambi supports native connectors for popular SaaS platforms (Salesforce, Microsoft Dynamics 365, Google Analytics) as well as generic ODBC/JDBC connections for on‑premise databases.
The wizard walks you through authentication, selects tables or views, and lets you schedule automatic refresh intervals ranging from every five minutes to daily batches.
Usage is centred around the “Explore” and “Present” modes. In Explore, you can slice and dice data, apply filters, and switch between visualisation types with simple gestures. The interface is built for touch, so pinch‑to‑zoom, swipe, and tap‑to‑drill actions feel natural on a tablet. When you’re ready to share insights, switch to Present mode to lock the dashboard layout, add annotations, and export the visualisation to PowerPoint or PDF with a single tap. Roambi also integrates with Microsoft Teams and Slack, allowing you to push live dashboards directly into chat channels for instant collaboration.
Supported Operating Systems: iOS 13 and later, Android 8.0 and later, Windows 10 (and Windows 11) for the web client, and macOS 10.14 or newer for Safari‑based access. The app is fully responsive, so you can also use it on Chrome OS devices or any desktop browser that supports HTML5.
Because the platform is cloud‑first, updates are rolled out automatically without any user intervention. Security patches, new visualisation types, and performance enhancements are delivered in the background, ensuring that every user always works with the most current version. For organisations with strict IT policies, Roambi offers a private‑cloud deployment option that can be hosted within your own virtual private cloud (VPC) while still preserving the same mobile‑first experience.
Pros, Cons, FAQ and Final Verdict
Pros
- Fully mobile‑optimised UI that delivers interactive visualisations on any device.
- No on‑premise server requirements – rapid deployment and low total cost of ownership.
- Robust data‑connector library with real‑time sync and offline caching.
- Enterprise‑grade security, including SSO, MFA, and role‑based access controls.
- AI‑driven insights that surface trends without manual analysis.
- Easy sharing and export options for polished presentations.
Cons
- Initial learning curve for users unfamiliar with modern BI concepts.
- Advanced custom calculations may require basic knowledge of Roambi’s expression language.
- Feature‑rich interface can feel overwhelming on smaller smartphones.
- Private‑cloud deployment incurs higher pricing than the standard SaaS plan.
Frequently Asked Questions
Is Roambi Analytics a free tool?
Roambi offers a 14‑day free trial, after which a subscription is required. Pricing is tiered based on the number of users and data connectors, with a separate enterprise plan for private‑cloud hosting.
Can I connect Roambi to on‑premise databases?
Yes. Roambi supports ODBC/JDBC connections, and a secure gateway can be installed on your network to tunnel data safely to the cloud.
Does Roambi work offline?
The mobile app caches the most recent visualisations, allowing you to view dashboards without an internet connection. Changes made offline sync automatically once connectivity is restored.
What security certifications does Roambi have?
Roambi is ISO 27001 certified, complies with GDPR, and offers SOC 2 Type II reports for enterprise customers.
How quickly can I create a dashboard?
Using the drag‑and‑drop builder, most users can assemble a functional dashboard in under 30 minutes, provided the data source is already connected.
Final Verdict
Roambi Analytics stands out in the crowded BI market by marrying powerful data visualisation with a genuinely mobile‑first experience. For mid‑size organisations that need fast deployment, secure cloud hosting, and the ability to deliver insights straight to the hands of field staff, Roambi delivers a compelling value proposition. While the platform does demand an upfront investment in training, the extensive learning centre and intuitive UI reduce the time to competence. If you are looking for a secure, scalable, and future‑proof analytics tool that eliminates the hassle of server maintenance and provides AI‑enhanced insights on any device, Roambi Analytics is worth a serious look.
Ready to transform your data into actionable visual stories? Download Roambi Analytics now and start your free trial today.
Rating: 4.5/5
Pros: Mobile‑first design, real‑time cloud sync, AI insights, strong security.
Cons: Learning curve, advanced calculations need basic scripting knowledge.



.png)